Regional insights
Understanding the pulse of Southeast Asia's airspace
Air traffic is a highly interconnected system. Every day, thousands of flights, airports and air navigation service providers influence each other's performance across the region.
AIR Lab transforms operational data into a shared regional picture, to understand traffic flows, identify bottlenecks and support collaborative decision-making.
Why it matters
As traffic continues to grow, airspace complexity grows with it.
Source: IATA 20-Year Passenger Forecast
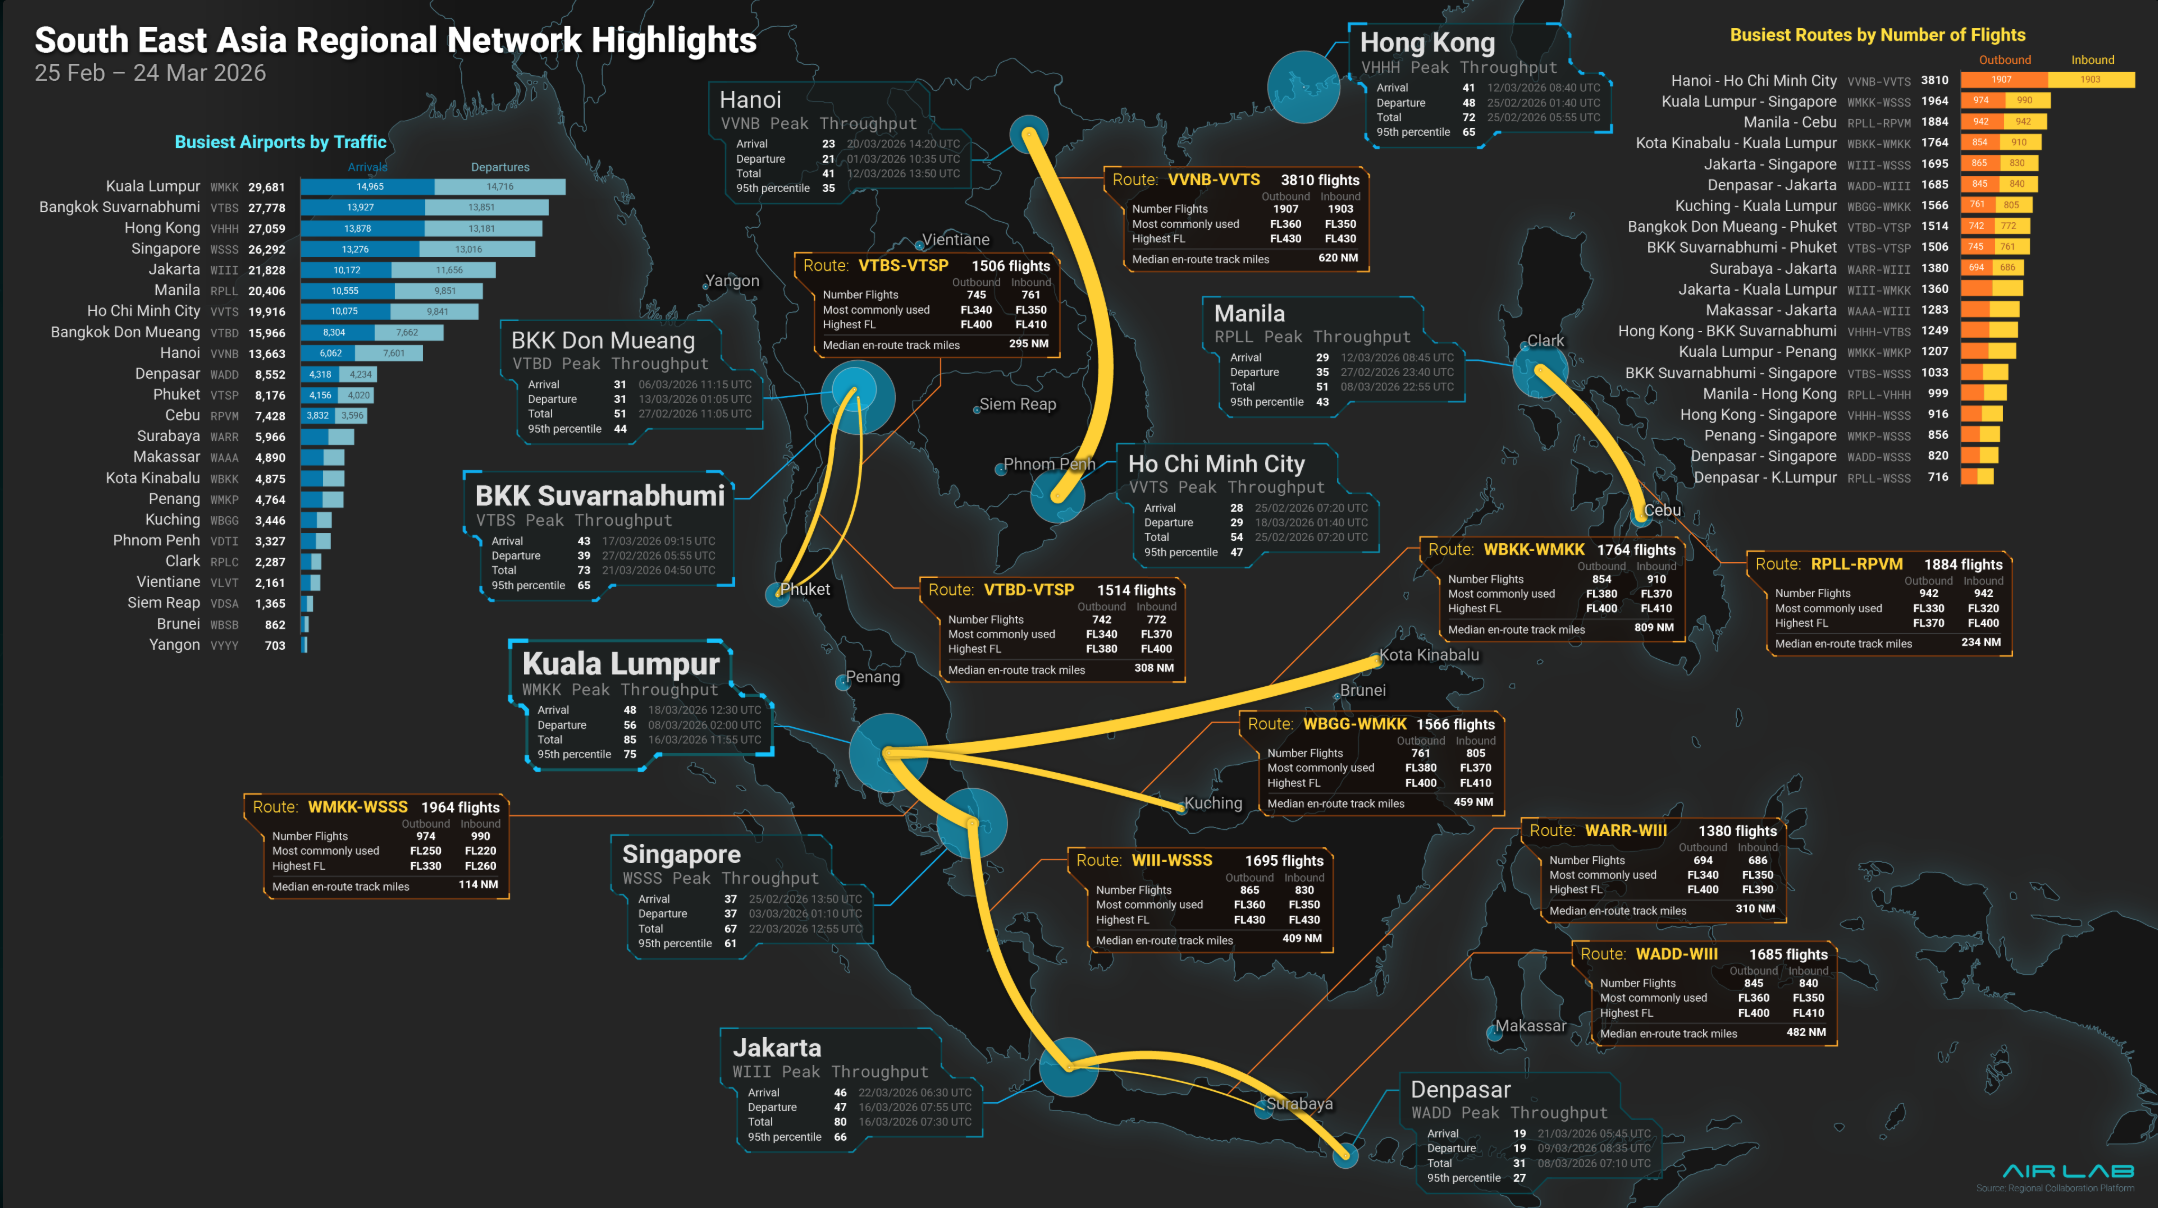
Regional insights at a glance
This visualization highlights the busiest airports, major traffic flows and key city pairs across Southeast Asia, revealing how interconnected the regional aviation network has become.
 Live regional situational awareness, South East Asia airspace
 From data to intelligence
Data alone does not improve performance. AIR Lab combines operational, traffic and network data to generate actionable insights.
Traffic flows
Where traffic is concentrated and how it evolves.
Click to explore →Traffic flows
- 6,252,536 aircraft movements analysed across the network.
- ~30,000 aircraft movements at the busiest airport during the analysis period.
- 3,800+ flights on the busiest city-pair corridor in a single month.
Traffic analysis reveals where demand concentrates and how flows evolve across the network.
Data — April 2026 Click to go back ←Network dependencies
How disruptions in one location can impact the wider region.
Click to explore →Network dependencies
- Critical bottleneck identified as having the highest influence on regional connectivity.
- Connectivity mapping reveals where disruptions may propagate across multiple sectors and neighbouring airspaces.
- Top 5 Most Connected Airports highlights the network's most influential traffic hubs.
Understand how traffic flows are interconnected and identify the routes, sectors and nodes that have the greatest influence on network performance.
Click to go back ←Capacity & demand
Where pressure points are emerging and where additional coordination may be needed.
Click to explore →Capacity & demand
- Capacity hotspots across the network.
- Airspace utilisation and demand pressure trends.
- Peak demand periods and congestion patterns.
- Emerging bottlenecks and future constraints.
- Demand-to-capacity balance across routes and sectors.
Identify where demand is approaching operational limits and where future constraints may emerge.
Click to go back ←Looking beyond today's operations
The real value of regional data lies not only in understanding what happened, but also in preparing for what comes next.
Join the conversation
Regional challenges cannot be solved by a single stakeholder. AIR Lab brings together ANSPs, airports, airlines and industry partners to explore how data and innovation can help shape the future of airspace management.
Interested in contributing or learning more?